


")


This article is part of our coverage of the latest in AI research.
Given the large size and computational costs of large language models (LLMs), there is growing interest in LLM compression techniques that have minimal impact on their accuracy on benchmarks. However, a new study by Microsoft Research shows that accuracy metrics do not guarantee that a compressed model will produce the same results as its larger counterpart.
The research reveals that while compressed models might retain their accuracy scores, their internal behavior can change considerably, leading to unpredictable results in real-world applications.
The accuracy trap of LLM compression
Some common LLM compression techniques include quantization, which reduces the precision of model parameters, pruning, which removes redundant or less important parameters, and key-value cache compression, which shrinks the model’s memory footprint.
The prevalent method for evaluating these compression techniques is to measure the accuracy of the compressed models on popular benchmarks.
The Microsoft researchers conducted a comprehensive study, evaluating the effects of quantization on several open-source LLMs, including Llama-2-chat. They tested the compressed models on different types of benchmarks, including multiple-choice question answering (MMLU, ARC, Winogrande, Hellaswag) and generative tasks such as math word problems (GSM8k) and creative writing (MT-Bench).
Their findings show that quantized models exhibited significant differences in their predictions even though their accuracy remained within 1% of the baseline LLM. A substantial portion of the answers that were correct in the original model became incorrect after quantization, and vice versa. They called this phenomenon “flips.”
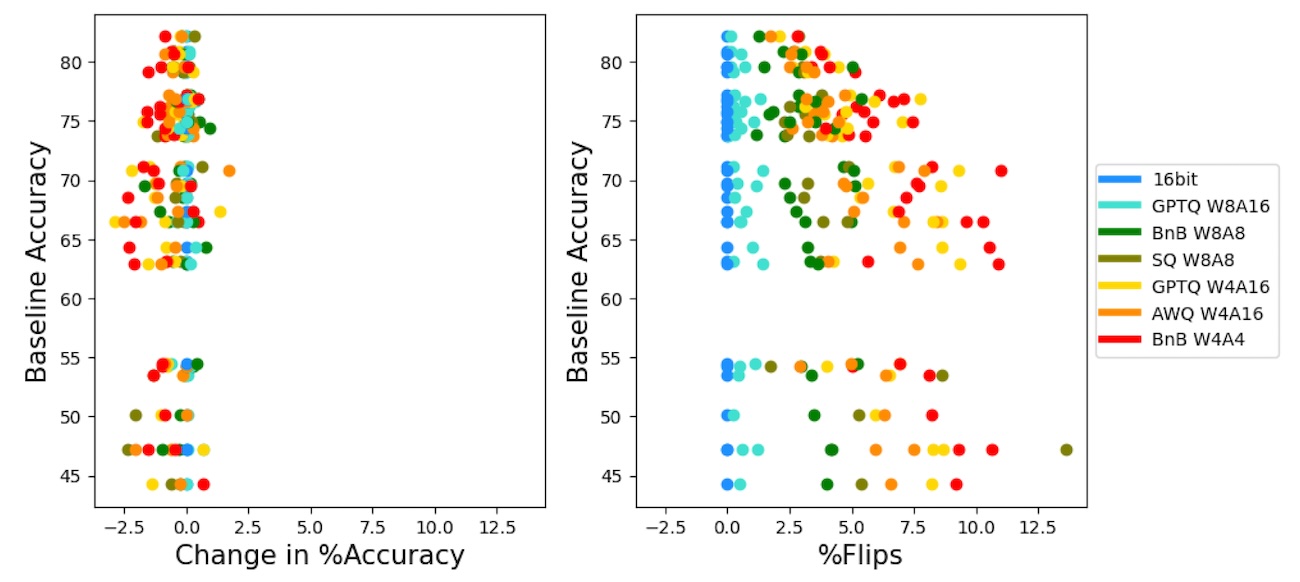
In some tasks, flips occurred in up to 15% of the questions, even though the overall accuracy score of the model remained almost the same. Other compression methods, such as dropping the last N layers of the model and pruning, had more pronounced flip rates, reaching 25% and above.
The impact of compression was more evident in generative tasks, such as solving math word problems, where flip rates after quantization surged to 12–30%.
Why do flips happen?
“The phenomenon of flips is puzzling at first glance,” the researchers write. “While it is easy to see that some correct answers may become incorrect due to errors induced by compression, it is hard to explain how an equal number of incorrect answers become correct such that overall accuracy is preserved!”
To explain this phenomenon, the researchers introduce the concept of “top margin,” which is the difference in token probabilities between the best and second-best answer options. A higher top margin indicates that the model is more certain about its prediction.
They hypothesize that answers with lower top margin scores are likelier to change after compression, as even small changes to model parameters can impact which answer comes out on top.
The study also shows that correct answers tend to have a larger top margin than incorrect answers. This means that the model is generally more confident about its correct predictions, which is also why flips are not evenly distributed across all answers.
The need for new evaluation metrics
If you enjoyed this article, please consider supporting TechTalks with a paid subscription (and gain access to subscriber-only posts)
The study underscores the need for evaluation metrics that go beyond accuracy. Relying solely on accuracy as a measure of performance can create a false sense of reliability, as it masks significant changes in the model’s internal workings.
“Since the goal of compression schemes is to create models that mimic the baseline models as closely as possible, we argue that compressed models are better judged by distance metrics with respect to baseline, in addition to capability metrics such as accuracy alone as is the practice today,” the researchers write.
Distance metrics measure how dissimilar two probability distributions are. In the context of LLMs, distance metrics can quantify how much the behavior of a compressed model deviates from the original model. The researchers propose using well-established distance metrics like Kullback–Leibler (KL) divergence to evaluate compressed models. KL divergence measures the difference between the probability of two distributions, which in this case are the original and compressed models’ predictions. A lower KL divergence indicates a closer match between the two models.
The researchers found that KL divergence correlates well with flip rates. They also observed a strong correlation between flip rates and performance on the MT-Bench benchmark, which measures the free-form generation capabilities of LLMs.
Based on these findings, the researchers suggest that flip rate, being a simple and computationally inexpensive metric, can serve as a practical proxy for distance metrics, especially in evaluating LLM compression techniques.
These findings are especially relevant as benchmarks have often proven to be inaccurate representations of a model’s true capabilities in the real world. LLMs are typically used in downstream tasks that require generating free-form text. In such cases, accuracy, which is based on the first token generated by the model on a question-answering task, could be a poor measure of the compressed model’s performance. On the other hand, if the downstream task is very similar to the benchmark task, accuracy might suffice.
My own experience is to do a vibe check of the compressed model with a set of hand-crafted prompts that are representative of the problem you want to solve. That should give you a good estimate of how far you can trust the optimized model.